One in a Hundred
2024 data · World Bank, WID · Forbes 2026
One in a Hundred2024 data

Shrink the world to 100 people. Where do you stand?

2 · WHO IT SUPPORTS
1ADULTS
0CHILDREN
Worked out on your phone.Worked out in your browser. Your numbers never leave it.
#––Fill in your pay and press Rank me to take your place.Press Rank me to take your place.
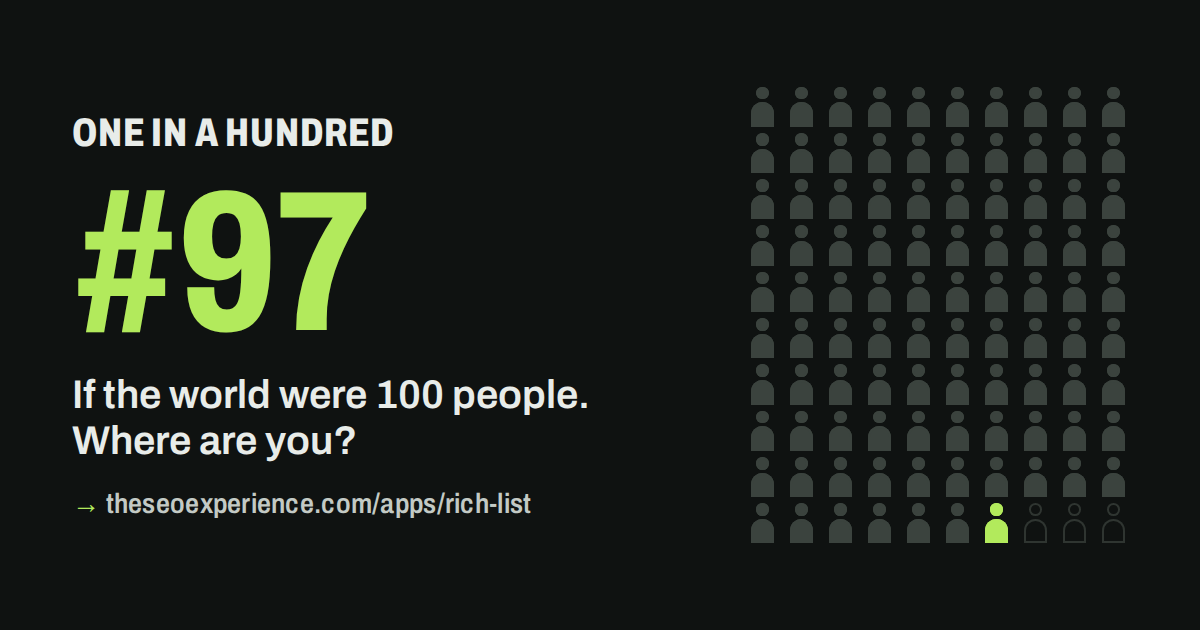
SOMEONE SHARED THIS SPOT# of 100If the world were 100 people. Where are you?
YOU’RE PERSON · BY INCOME#1 of 100Richer than 0.0% of the world.
#1 · POORESTRICHEST · #100
Each figure stands for 81 million people. Grey figures live on less than you.
—a day for each person in your homea day for each person at this spot
—what the middle person lives on
—people live on less
CHAPTER 1

You vs your neighbours in line

You live on $94.66 a day per person.
#10 in line 31.8× more lives on $2.98 a day than them
#50, the middle person 10.3× more lives on $9.20 a day than them
#90 1.8× more lives on $54.02 a day than them
#99, where the top 1% starts 1.7× less lives on $162.71 a day than them

Visit any spot

#97$94.24 / day
#1#50#100

That’s about $39,819 a year for one person in the US.7.83 billion people live on less.

CHAPTER 2

If all the world’s wealth were $1,000, split between 100 people

Wealth is everything people own (homes, savings, pensions, investments) minus their debts.

Shared by 1 adult
#––of 100 adults by wealth.
Wealthier than —%. The adult in the middle owns $28,583.
Enter what your household owns to find your spot by wealth.
The adult in the middle owns $28,583.
POOREST HALFMIDDLE 40NEXT 9THE 1%
0% −$8.8
10% $1.8
20% $4.9
30% $9.3
40% $15
50% $24
60% $37
70% $61
80% $116
90% $374
THE 1% $365
EACH BAR IS ONE PERSON · EACH BRICK IS $1 · THE 1% BAR IS ONE PERSON, DRAWN 9 WIDE
POOREST HALF
−$8.8#1–10
$1.8#11–20
$4.9#21–30
$9.3#31–40
$15#41–50
MIDDLE 40
$24#51–60
$37#61–70
$61#71–80
$116#81–90
NEXT 9
$374#91–99
THE 1%
$365#100
EACH LINE IS ONE PERSON · EACH BRICK IS $1 · THE 1% IS ONE PERSON, DRAWN 9 LINES THICK

The richest person holds $365. The poorest 50 people share $22.

World Inequality Database, 2024. Net wealth per adult; each bar is one percentile’s share. The poorest 6 people owe more than they own, so their bars are empty.
CHAPTER 3

Inside the richest figure

Figure #100 stands for 81 million people. Inside it are 3,428 billionaires, together worth $20.1 trillion. Pick one to compare.

Forbes World’s Billionaires 2026, net worth on March 1, 2026.

You vs Bill Gates

$108 billion vs your household’s $40,000 a year
$49 per second since their birthOn average, over 70 years. You take home $0.0013 a second. Your whole year’s pay, at their rate: 13.7 minutes.
2.7 million yearsof your take-home pay to match the fortune. That’s 9.0× as long as modern humans have existed.
2.7 kmIf a year of your pay were a 1 mm line, this is how long the fortune would be.
296 yearsto spend it all at $1 million a day.
—what you own. That’s how much more Bill Gates owns.Add what you own in chapter 2 to compare fortunes.

How this works

Your pay ÷ US prices (2021 PPP, adjusted for inflation to 2024) ÷ people in your home ÷ 365, placed among the 2024 World Bank global percentiles. Same method as Giving What We Can’s “How Rich Am I?”. Wealth is your net worth ÷ adults sharing it, placed among WID’s 2024 global wealth percentiles.

Limits

Rich countries measure income, most others consumption. Surveys miss the very top, so ranks stop at 99.9, which is why billionaires get their own chapter. 2024 is the latest real year. US dollars only.

Sources

Download the data (JSON)

Enjoyed the free app? Support my work.

One in a Hundred is free, has no ads, and nothing you type is stored. If it made you think, a coffee keeps the next one coming.
Buy me a coffee
#97 Save image Buy me a coffee
Share your spotShare card: your spot among 100 people
I’m #97 of 100. Richer than 96% of the world. Where do you stand?
Your income is never in the link, only your rank.